
|
Australian Antarctic Automatic Weather Stations
Antarctica - valued, protected and understood
|
|
|
Australian Antarctic Automatic Weather Stations
Antarctica - valued, protected and understood
|
Reading Australian Antarctic automatic weather station netCDF data
Several software packages specifically designed to process Australian Antarctic automatic weather station data are available at this website.
There are a number of IDL programs to read, display and plot the AWS netCDF data (section A). Note that IDL, short for Interactive Data Language, is a commercially available programming language used for data analysis, and is not supplied with the software available from this website. Additonally, there are two Fortran programs - one converts the AWS netCDF data into a simple ASCII text file (section B), and the second uses NCAR graphics to plot the data (section C). A Fortran 95 compiler is required to compile and run both these programs. (A) IDL software to read, display and plot automatic weather station netCDF data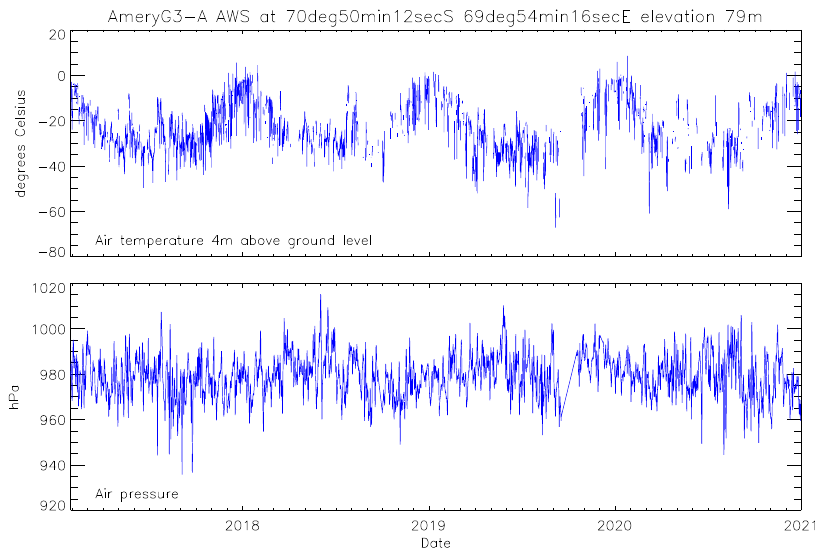
Download the IDL code as a tar file. After unpacking the tar file you should have the following files in your current directory:
The main routines are awsplot.pro and aws2ascii.pro, both of which call aws_info.pro to retrieve information from AWS netCDF data files. The other routines are small utility programs that are required for the main routines to work. Below are two examples of how to use the main routines to make a plot of the netCDF data (results shown in figure to the right), and to convert the netCDF data into a simple ASCII text file. In each example, if no arguments are given the program prompts for the required information. (B) Fortran software to convert automatic weather station netCDF datafiles to text
This section provides a small program to convert automatic weather
station data into text for spreadsheets. It is intended for people
with a little unix or linux knowledge.
The program also provides maximums, minimums and means for periods selected by the user.
Download and run the program by following the four steps below. The
program requires a Fortran
90 netCDF library to be installed on your unix or linux system at /usr/local/netcdf
(check this with your system administrator).
1. Download the software to an empty unix or linux directory. 2. You now have a file called antarcticaws.tar in your directory. Now enter these two commands at the prompt: 3. There should now be several files in your directory. One of them is an executable called antarcticaws. In the same directory, download the AWS netCDF datafiles from the data table at this website. 4. This is an example of how to run the program using the datafile "Lanyon_antarctic_aws_1991_1998.nc". In the directory, enter: You should now have information on your screen about the time observations span and variables available from the datafile. You are asked to enter the number of variables you wish to extract and then the order in which you want the data. You will then be asked the timespan for which you require observations. Finally, the program provides information on that data and makes a text file. This file can be imported into spreadsheets. 
(C) An NCAR graphics application for graphing AWS data
This section provides a Fortran 95 program that uses
NCAR graphics to graph
Australian Antarctic AWS data. To use the software available here, you must first
have NCAR graphics installed on your system, together with the
Unidata Fortran 90 netCDF library.
The software available here is designed specifically to run on a Unix workstation or X-term, and is meant
for regular unix or linux users. An example of the output is shown in the figure.
Download the code as a tar file. To compile the program, a makefile is included as part of the tar file, and the locations of the NCAR and netCDF libraries should be changed in the makefile to match those of your system. The executable will appear as graphaws in your compiling directory. To graph data from an AWS netCDF file, place the file name after the executable on the command line. For example, to graph data from GC41, you would download GC41_antarctic_aws_1984_2000.nc to your running directory, and then type The program will provide you with a series of format options before opening a graphics window to display the data you have chosen.
If you intend to make changes to this graphing software, please note that it is a truncated
version of a much larger program and many global variables are unused in this version.
|
|
|